An AI Interface for Interrogating Data
Project Brief
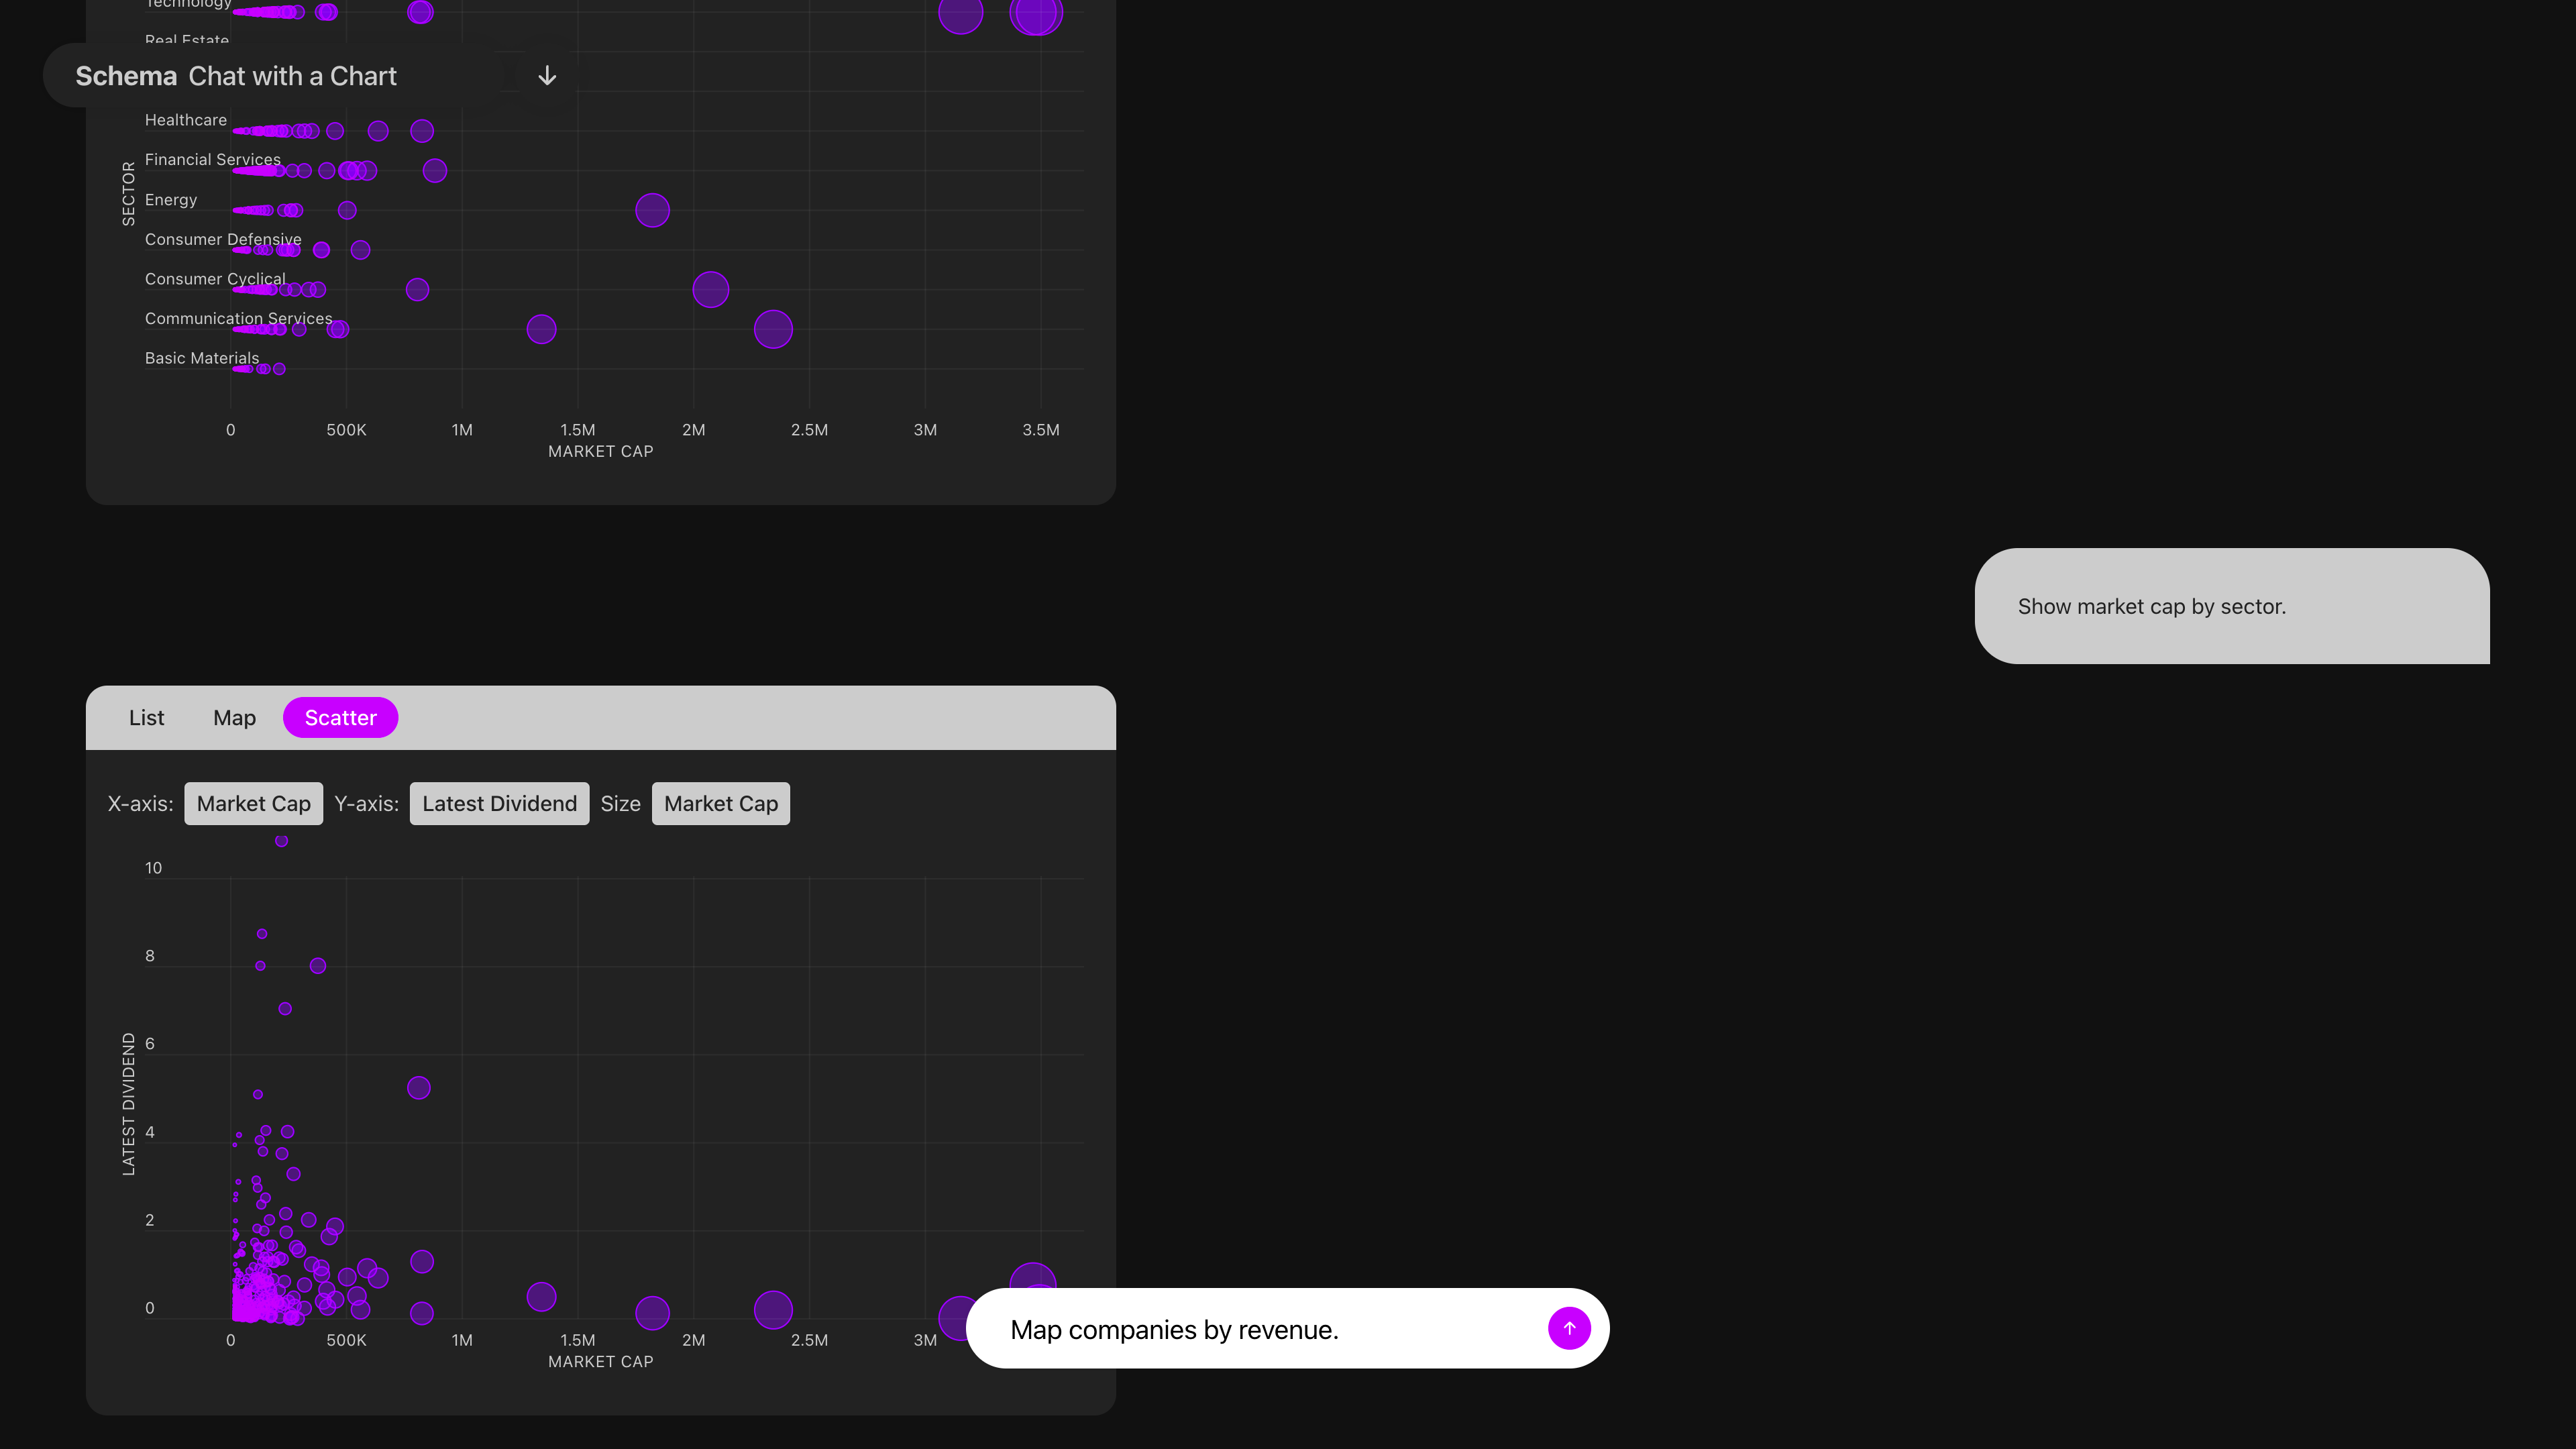
This prototype transforms how users engage with financial data by making visualizations accessible through natural language prompts. Instead of building charts manually, users can simply ask for one, and the system responds with a tailored visualization, dynamically mapped across list, map, or scatter views. Users can quickly shift variables (e.g., Market Cap, Sector, Domicile) using an adaptive UI, combining the familiarity of dropdowns with the flexibility of generative input.
This prototype showcases how conversational UX can lower the barrier to data exploration—turning complex queries into intuitive visuals for analysts, policy advisors, and decision-makers.