AI-Enabled Personalized Workspaces
Project Brief
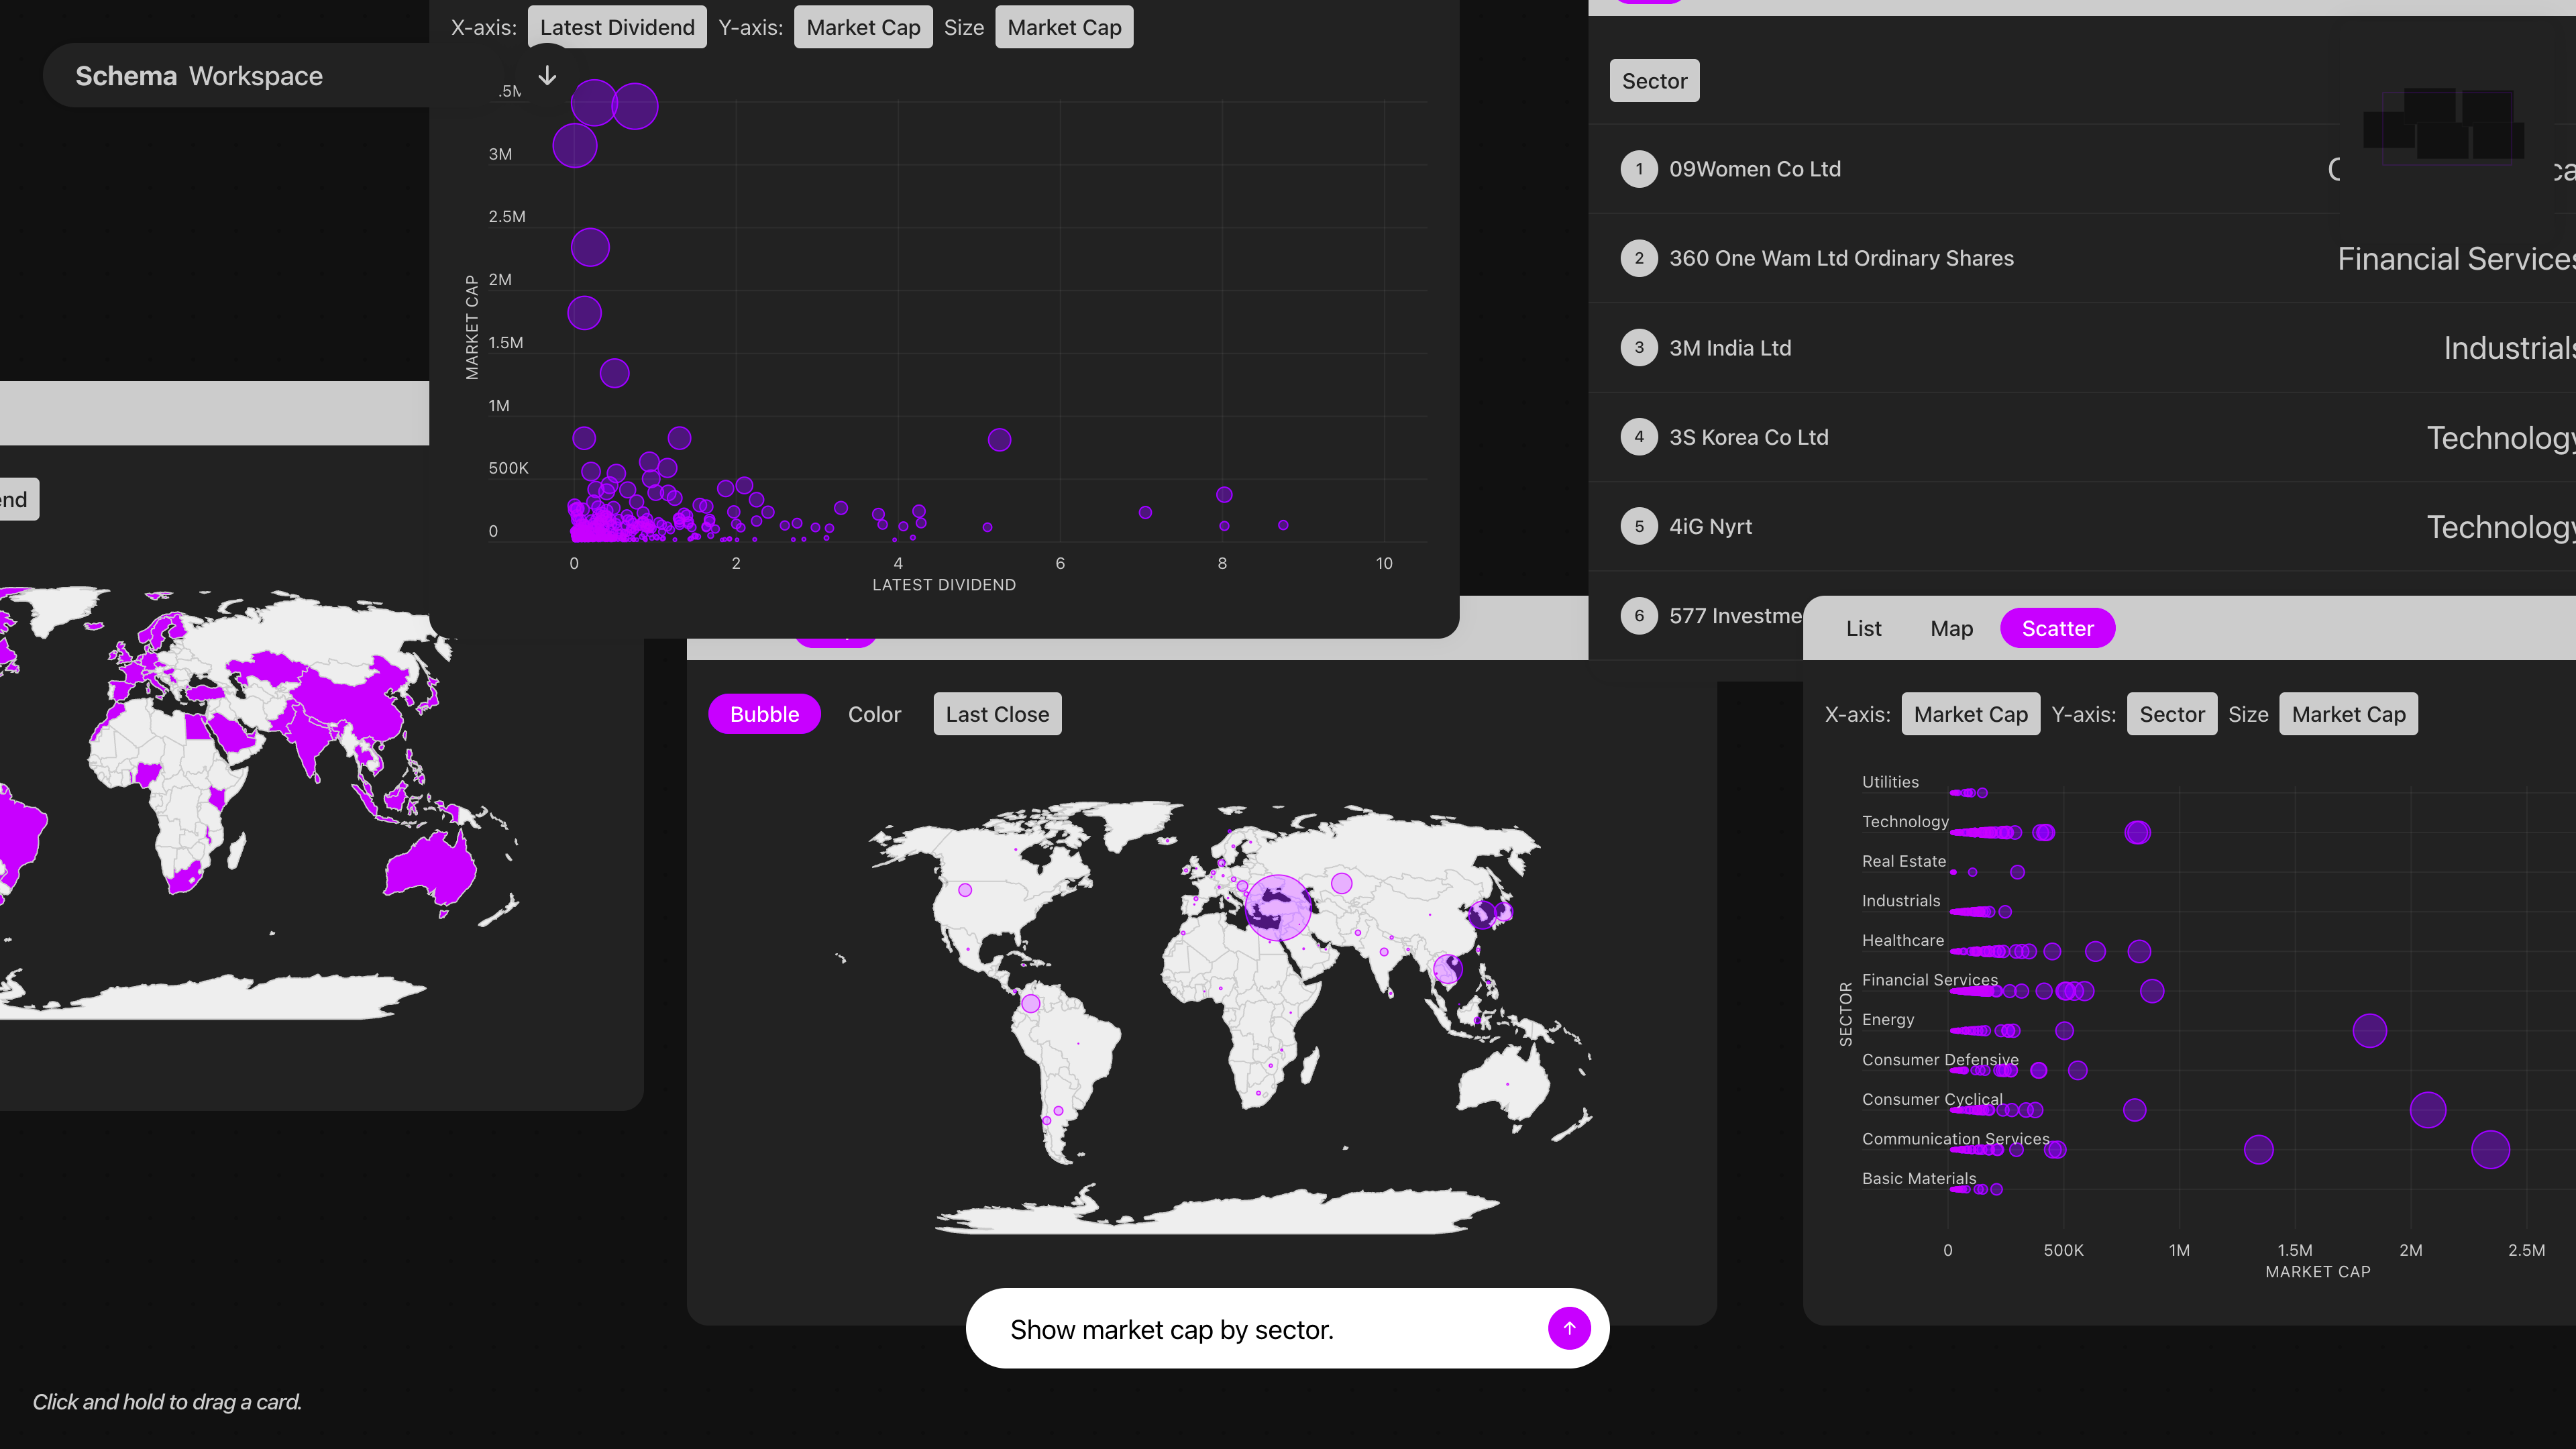
Workspaces extends the conversational charting concept into a flexible interface where users can generate, compare, and manipulate multiple data visualizations in one space. By asking questions in natural language—“Which companies have high dividends?”—users summon live data cards that can be arranged, layered, or revisited across different chart types and dimensions.
Each card acts as a modular lens, letting users construct narratives, test hypotheses, or track patterns visually. This prototype illustrates how generative AI and interface design can converge to create a more iterative, exploratory, and personalized relationship with data.